Profiling Command
Understand the engine debug options
- If capturing GPU: enable detailed draw call name events etc
sh
r.RHISSetGPUCaptureOptions 1- If capturing CPU: enable detailed callstack information
sh
statNamedEvents
statVerboseNamedEvents- Some tools might need extra variables enabled to be supported
sh
bEnableMemoryAnalyser
bEnablePIXProfiling
Consider Profiling Setup
- Remove all optimasation that adjust frame based on frametime (vsync, smooth framerate, dynamic resolution)
- Create a deterministic replay scenario
- Add automated profiling/capture recording (PIX, playstation profiling)
Explore Profiling
- Explore the scene with visual Viewports, show commands (for ex to only see LODs of a certain level), stats on screen
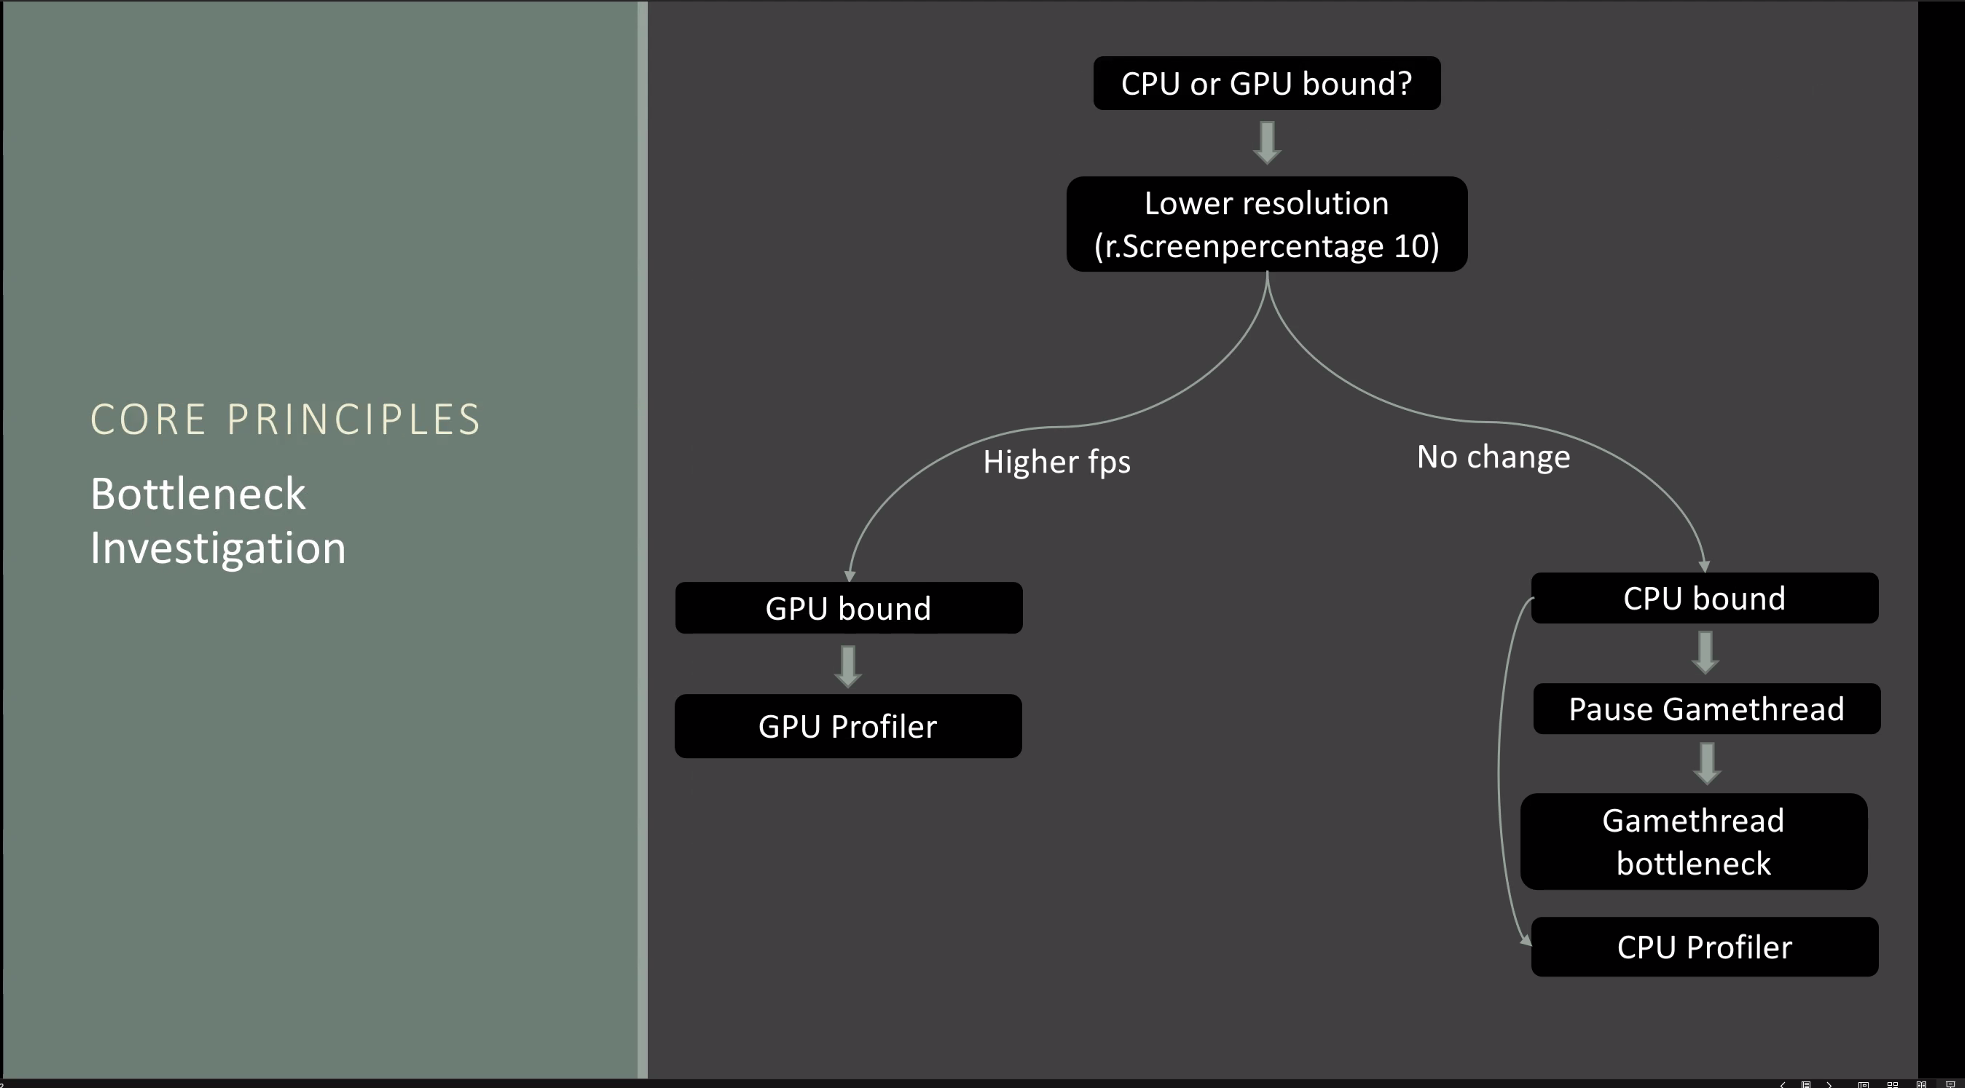
Bottleneck Investigation